
What record volumes, electrification and a thinning talent pool demand of India's automotive suppliers, and how a factory operating layer answers each.
At a glance
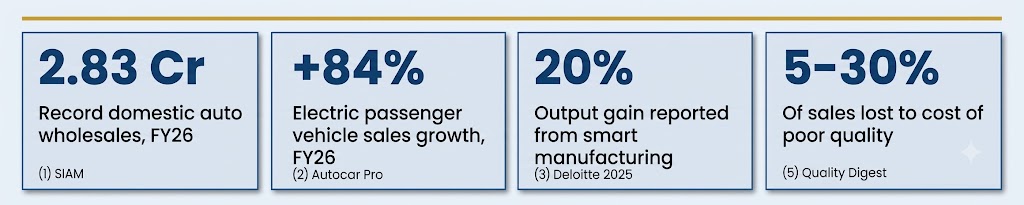
Demand isn't the constraint. Execution is. India's auto industry posted record domestic wholesales of 2.83 crore units in FY26, with two-wheeler exports up 23.4% and passenger vehicle exports up 17.5%.[1]
The part mix is changing faster than the plants. EV sales hit 2.45 million units (8.27% penetration), and electric passenger vehicles grew 84% in a year.[2] New part families mean more variants, more changeovers and new traceability needs.
The leaders are pulling away. Manufacturers investing in smart manufacturing report up to 20% more output and 15% capacity unlocked,[3] and Lighthouse factories report 31–90% fewer defects.[4]
For a representative ₹250 crore Tier-1, the modeled prize is about ₹5 crore a year, roughly 2% of revenue, from quality, maintenance, changeover and energy (Exhibit 2).
01 The landscape
Five forces are reshaping the automotive shop floor
Volume, product mix, people, quality and assets are all changing at once. Each force on its own is manageable. Together, they overwhelm plants that still run on spreadsheets, registers and tribal knowledge.
Exhibit 1 Five forces and what each demands of the plant
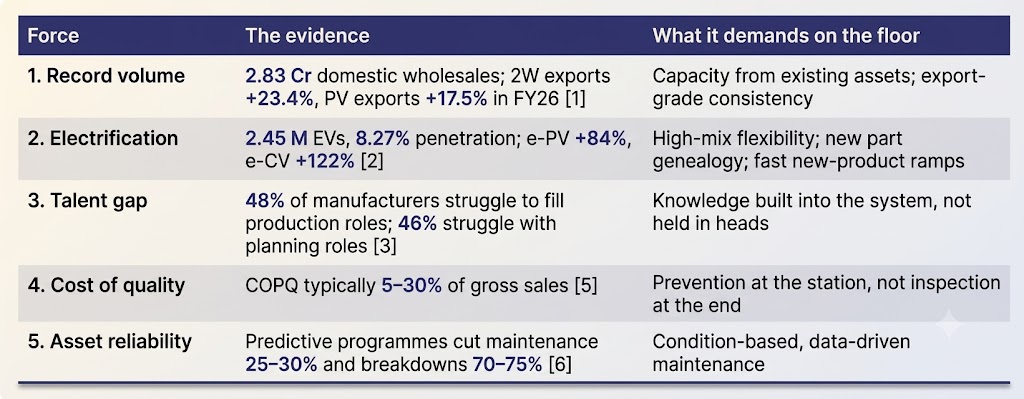 Sources: SIAM [1], Autocar Professional [2], Deloitte [3], Quality Digest [5], U.S. DOE/PNNL [6]
02 Force by force
How Industrial OS answers each force
Force 1: Record volume. Find capacity before you buy it
THE EVIDENCE Indian OEMs sold more vehicles in FY26 than in any year before,[1] and exports are growing faster than domestic sales. Suppliers face a familiar question: add a shift, buy machines, or get more from what they already have.
THE INDUSTRIAL OS ANSWER Production Execution and the Industrial Edge make hidden capacity visible: machine-verified OEE, loss trees by cell and shift, and 4M root-cause analysis. Plant Visibility & Analytics puts output against each OEM programme in front of the plant head in real time.

Force 2: Electrification. Run high-mix without losing control
THE EVIDENCE Electric passenger vehicle sales grew 84% and electric commercial vehicles 122% in FY26.[2] For suppliers this means motor housings, battery enclosures, busbars and thermal parts running beside legacy ICE components, with more variants, shorter runs and stricter traceability.
THE INDUSTRIAL OS ANSWER Production Execution brings digital setup checklists and recipe control for faster, right-first-time changeovers. Serial-level genealogy covers safety-critical EV parts, and digital work instructions go live as soon as a new part number is released. Quality Lab Management holds first-article and material evidence for each new part in one place.

Force 3: Talent gap. Put the expertise in the system
THE EVIDENCE Nearly half of manufacturers report moderate to significant difficulty filling production and operations roles (48%) and planning and scheduling roles (46%).[3] When experienced setters and supervisors leave, their knowledge leaves with them.
THE INDUSTRIAL OS ANSWER Production Execution includes digital SOPs, operator skill matrices and role-based authorisation, so only qualified operators can start critical operations. Guided workflows shorten time to competence for new hires, and decision support flags anomalies that once needed a veteran to spot.

Force 4: Cost of quality. Prevent, don't inspect
THE EVIDENCE Cost of poor quality (scrap, rework, sorting, warranty, customer debits) typically runs at 5–30% of gross sales, and most executives believe their own figure is under 5%.[5] In automotive, where a single escape can trigger a containment at the OEM, the true figure is usually higher than leaders assume.
THE INDUSTRIAL OS ANSWER Production Execution enforces critical parameters and interlocks at the station. Quality Lab Management connects instruments, auto-validates against specs and puts failed material on hold before it reaches the line. AI-based drift detection flags out-of-spec trends before parts go out of tolerance.

Force 5: Asset reliability. Move from calendar to condition
THE EVIDENCE Most plants still run preventive maintenance by calendar, which over-maintains some assets and misses failures on others. The U.S. Department of Energy's O&M guide puts the payoff from a mature predictive programme at about 10× ROI.[6]
THE INDUSTRIAL OS ANSWER The Industrial Edge captures vibration, temperature, current and pressure from critical assets. Production Execution runs condition-based maintenance triggers, and AI/ML Optimisation predicts failures early enough to fix them during planned breaks. Energy, Utilities & Emissions adds compressor, furnace and HVAC health to the same view.

A note on the benchmarks
Lighthouse and survey figures show what leading manufacturers have achieved. They are not DelphEon results and not guarantees for any single plant. Use them to size ambition, then validate against your own baseline.
03 The sixth force on the horizon
Carbon is becoming a supplier KPI
OEMs increasingly expect suppliers to report the energy and emissions behind each part they ship. Lighthouse sites show how far measurement-led programmes can go: 16–90% cuts in Scope 1 & 2 emissions and carbon footprint reductions of up to 56%.[4]
Energy, Utilities & Emissions in Industrial OS measures energy at the machine, line and utility level, links it to production counts, and reports Scope 1 & 2 from metered data. That turns carbon from a year-end estimate into a per-part number you can manage and disclose.

04 The value case
Sizing the prize: a ₹250 crore EV-ready Tier-1
This time we modeled a different plant: a ₹250 crore Tier-1 supplier making die-cast and machined housings plus sub-assemblies for two-wheeler and EV customers. It runs high-mix, frequent changeovers and a growing headcount of new operators. Every assumption is shown so you can replace it with your own baseline.
Exhibit 2 Modeled annual value for a ₹250 crore high-mix Tier-1 plant
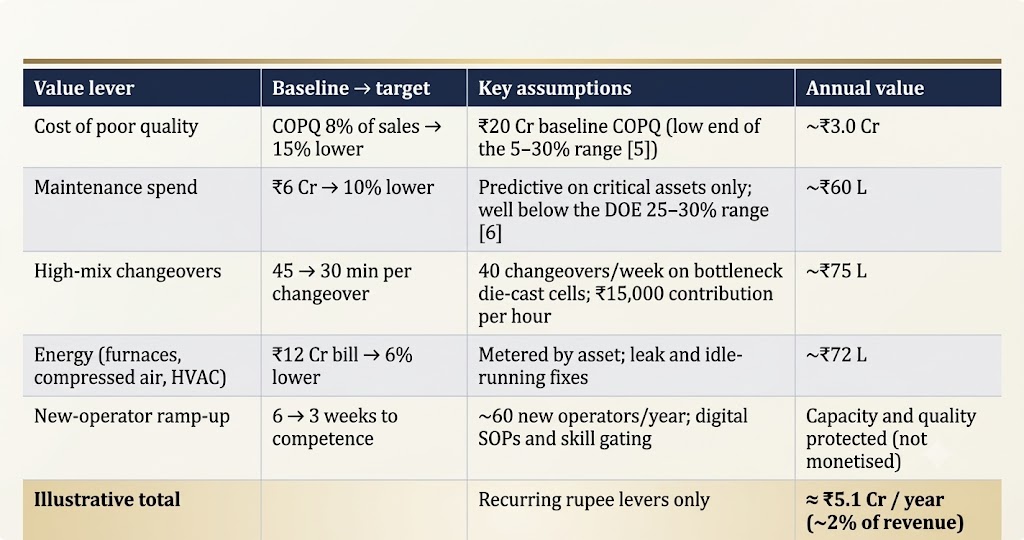 Modeled estimates for a representative plant, not client results. Benchmarks are applied conservatively, below the published ranges.
Reading the model
Quality dominates. Even at the low end of the COPQ range, a 15% reduction is worth more than the maintenance, changeover and energy levers combined. That's why prevention at the station and a connected lab come first in the roadmap.
05 Where do you stand?
A five-minute readiness check
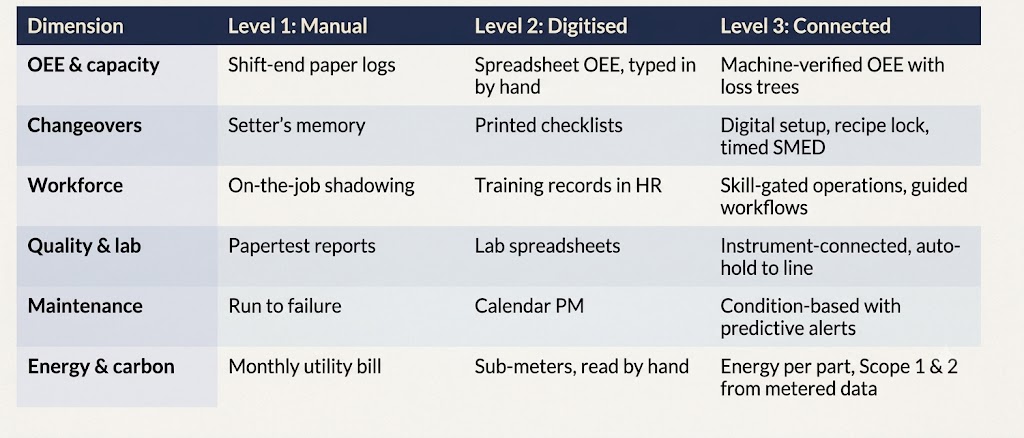
Score your plant on each dimension. Any dimension still at Level 1 or 2 is where the fastest returns usually are.
Exhibit 3 Connected-plant maturity scale
06 What leaders should do
Four priorities for the next 12 months
- Put a number on your cost of poor quality. Most leaders underestimate it.[5] Add up scrap, rework, sorting, debits and warranty by product family. That figure sets the size of the business case.
- Build the EV ramp into the system. Every new EV part number should launch with digital work instructions, genealogy and lab evidence from day one, not added after the first customer complaint.
- Protect against the talent gap. Capture your best setters' and inspectors' know-how in digital SOPs and skill gating before they retire or move on.
- Start predictive maintenance where it hurts most. Instrument the 10–15 assets whose failure stops the line. Calendar-based PM can stay everywhere else for now.
Next step: turn the forces into a plan
- COPQ and capacity diagnostic. We size your cost of poor quality and hidden capacity from your existing data.
- Readiness scoring. We place your plant on the Exhibit 3 maturity scale and identify the quickest Level 1 → 3 moves.
- Phased Industrial OS roadmap. Each phase has an outcome gate that your CFO signs off before the next one starts.